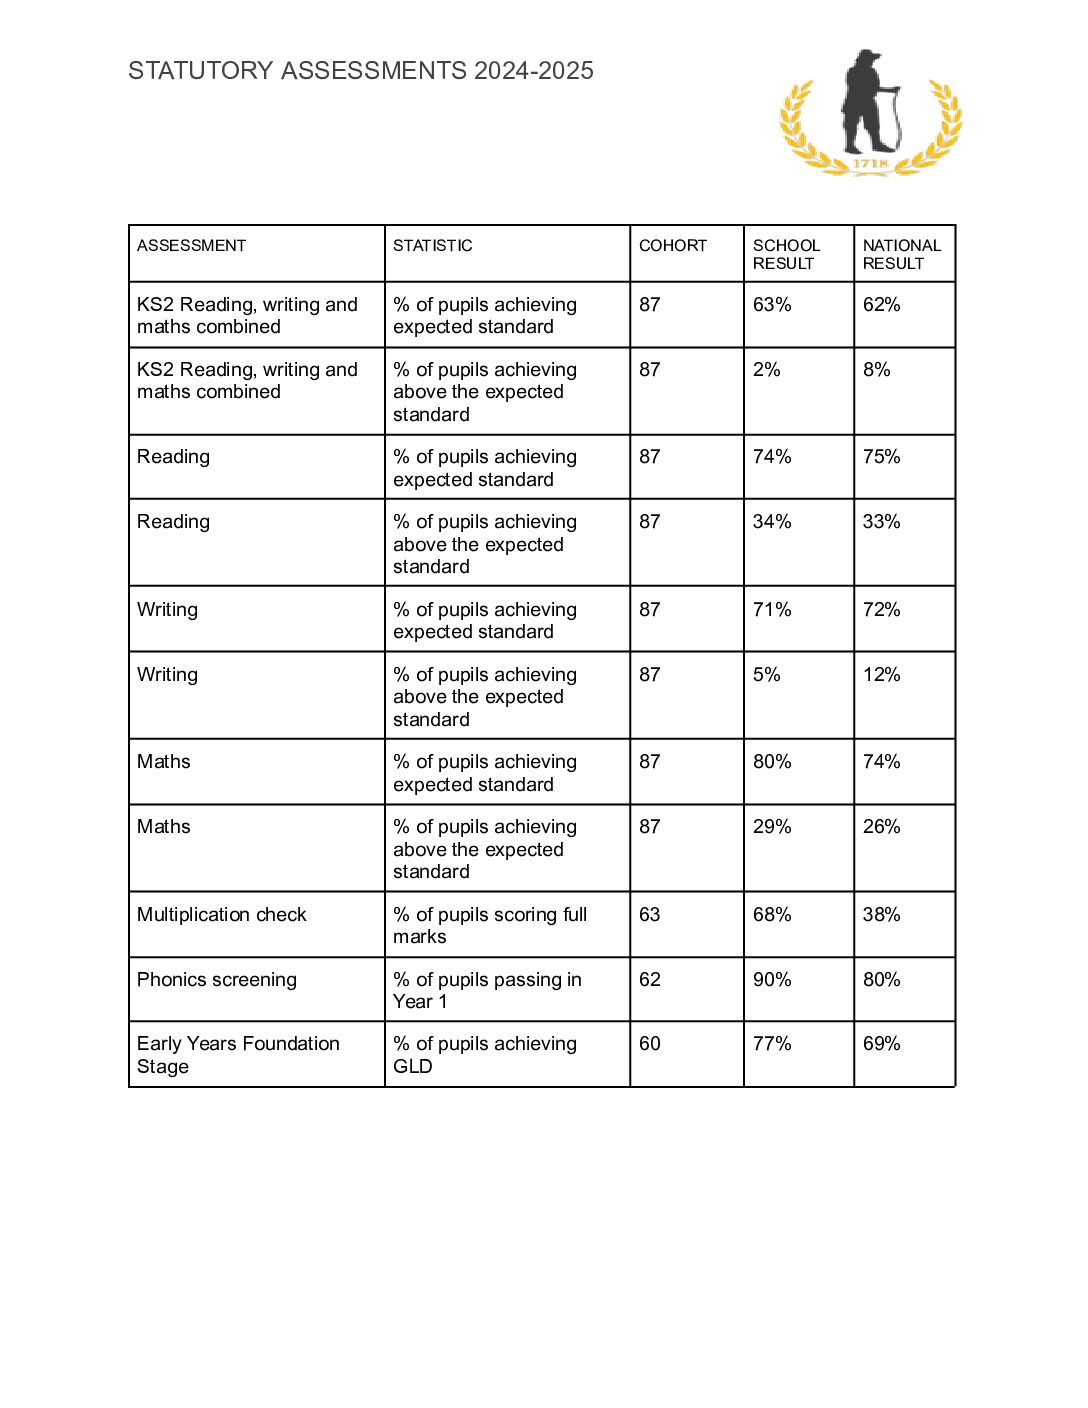
Please be aware that this is data for 2019 and therefore is not current.
Results and School Performance
JULY 2023 RESULTS
Since the challenges of the last couple of years our children have worked hard to retain a position above the national picture.
EYFS | ROBERT WILKINSON | NATIONAL AVERAGE |
Achieved GLD | 68% | 67% |
YEAR 1 PHONICS | ROBERT WILKINSON | NATIONAL AVERAGE |
Met the standard | 84% | 79.5% |
KEY STAGE 1 | ROBERT WILKINSON RESULTS | NATIONAL RESULTS | ||
Expected standard + | Greater depth | Expected standard + | Greater depth | |
READING | 85% | 34% | 68% | 18% |
WRITING | 75% | 12% | 59% | 8% |
MATHS | 78% | 16% | 70% | 16% |
KEY STAGE 2 | ROBERT WILKINSON RESULTS | NATIONAL RESULTS | ||
Expected standard + | Greater depth | Expected standard + | Greater depth | |
READING | 85% | 41% | 73% | 29% |
WRITING | 72% | 18% | 71% | 13% |
MATHS | 87% | 29% | 73% | 24% |
GPS | 80% | 30% | 72% | 30% |
RWM combined | 68% | 10% | 59% | 8% |
JULY 2022 RESULTS
Although our school results will not be published this year (via the link above) we would like to share these.
Since the challenges of the last couple of years our children have worked hard to retain a position about the national picture.
EYFS | ROBERT WILKINSON | NATIONAL AVERAGE |
Achieved GLD | 68% | 65.2% |
YEAR 1 PHONICS | ROBERT WILKINSON | NATIONAL AVERAGE |
Met the standard | 84% | 75.8% |
KEY STAGE 1 | ROBERT WILKINSON RESULTS | NATIONAL RESULTS | ||
Expected standard + | Greater depth | Expected standard + | Greater depth | |
READING | 77% | 21% | 68% | 18% |
WRITING | 57% | 6% | 59% | 8% |
MATHS | 77% | 24% | 70% | 15% |
KEY STAGE 2 | ROBERT WILKINSON RESULTS | NATIONAL RESULTS | ||
Expected standard + | Greater depth | Expected standard + | Greater depth | |
READING | 79% | 29% | 74% | 28% |
WRITING | 71% | 21% | 69% | 13.2% |
MATHS | 79% | 25% | 71% | 22.3% |
GPS | 76% | 38% | 72% | 29.7% |
RWM combined | 66% | 10% | 59% | 7% |